 |
|
|
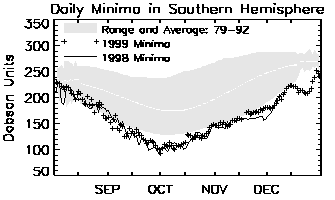
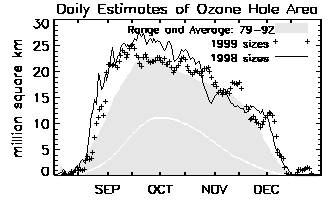
Ozone Hole Monitoring
 |
 |

|
Responsible NASA official & Web Team Dr. P.K. Bhartia, TOMS Project Scientist & Saira Zobair |
<=== The 1999 ozone hole as seen by GOME
===> current page at the TOMS site
 Jos van Geffen --
Home |
Site Map |
Contact Me