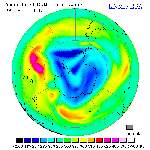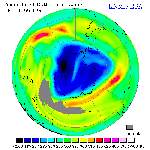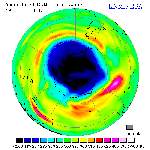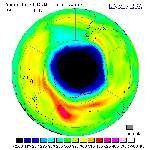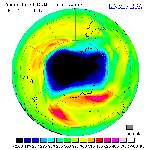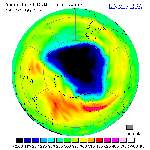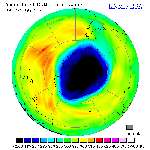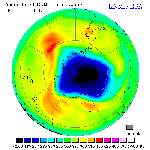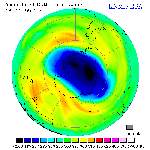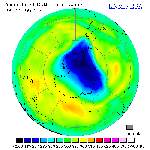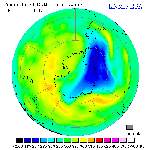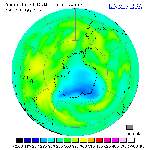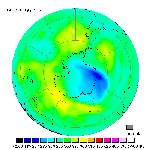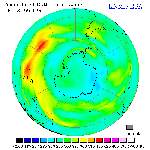
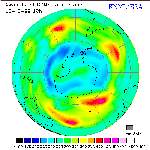
The 1999 ozone hole as seen by GOME

The Global Ozone Monitoring Experiment (GOME) is an instrument on board of the Earth Remote Sensing satellite 2 (ERS-2), launched in 1995 by the European Space Agency (ESA) to monitor the global distribution of ozone.

From the data collected by GOME, ozone maps are generated daily for 12 GMT on the basis of the GOME Fast Delivery Service, which was continued by TEMIS; the most recent pictures can be found on the Global Ozone field page.

 
Since the early 1980's an ozone hole occurs yearly over the South Pole, and also in 1999 the ozone hole is very visible again.

===> About ozone and the formation of the ozone hole
          (including some links)
The following table shows pictures of total ozone concentrations on the Southern Hemisphere based on GOME observations at 10 days intervals (click on a picture to get a larger one; 70-80 kb). All pictures are copied from the GOME Fast Delivery site and are © KNMI/ESA; see the Global Ozone field page at TEMIS for maps, data and details.

06 Aug 1999
06 Aug 1999
16 Aug 1999
16 Aug 1999
26 Aug 1999
26 Aug 1999
06 Sep 1999
06 Sep 1999
16 Sep 1999
16 Sep 1999
26 Sep 1999
26 Sep 1999
06 Oct 1999
06 Oct 1999
16 Oct 1999
16 Oct 1999
26 Oct 1999
26 Oct 1999
06 Nov 1999
06 Nov 1999
16 Nov 1999
16 Nov 1999
26 Nov 1999
26 Nov 1999
06 Dec 1999
06 Dec 1999
16 Dec 1999
16 Dec 1999
26 Dec 1999
26 Dec 1999
colour codesnodata colour

Ozone concentrations are given in Dobson Units (DU), where 100 DU is equal to a layer of 1 mm ozone at sea-level pressure and 0° C. There are about 3 molecules of ozone for every 10 milion air molecules. The ozone concentration in the Earths atmosphere is on average about 300 DU. The region above Antartica where the total ozone concentration is less than 200 DU is named the ozone hole.

In each of the above pictures, the thin circle around the Antarctican continent is 60° S and the outer thin circle is 30° S. Meridians are drawn at 30° interval, with the 0 meridian to the centre-right.

===> Depth and size of the 1999 ozone hole
From the data obtained with NASAs Total Ozone Mapping Spectrometer (TOMS)
 

The ozone hole of later years

Compared with the 1999 ozone hole, the 2000 ozone hole appeared earlier, grew faster, was deeper and bigger, and closed faster and earlier.
For pictures like those above for the 2000 ozone hole, see the picture archive at the Assimilated Ozone Columns page of the GOME Fast Delivery Service.
See for graphs of the depth and size of the ozone hole:
 =  graphs at the TEMIS website [formerly the GOME Fast Delivery Service]
 =  graphs of NASA's TOMS instrument


<=== My post-doc. research at KNMI page

 
Jos van Geffen -- Home  |  Site Map  |  Contact Me

created: 12 October 1999
last modified: 16 April 2012