(Click on the image for a larger version; 83kb.)
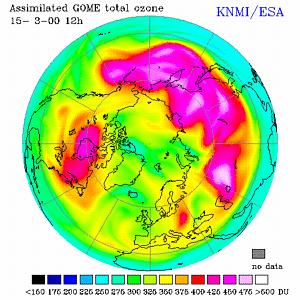
As a result of this, there is no large and long-lasting "ozone hole" formed at the Northern Hemisphere, and the minimum ozone concentrations -- occurring normally early March -- are not so low as on the Southern Hemisphere. These Northern ozone-lows are quickly filled by inflow of ozone from elsewhere and they are a very local phenomenon: at the same time elsewhere on the Norther Hemisphere ozone values can be much higher (normal).
Nevertheless, the local and average decrease in ozone at the Northern Hemisphere is also significant. And there are indications that temperatures in the stratosphere are going down in Spring, giving rise to more and longer existing PSCs. So perhaps the decrease of minimum ozone values on the Northern hemisphere is not over yet, even though CFCs are no longer being used at a large scale.

|
The total ozone concentration given in Dobson Units (DU), where blue are
low and black extremely low values, green represent average values, above
the Northern Hemisphere at 16 March 2000, assimilated using observations
from the Global Ozone Monitoring Experiment (GOME) onboard ESA's ERS-2.
[0° longitude is pointing downward.]
(Click on the image for a larger version; 83kb.) |
| source: GOME Fast Delivery Service, © KNMI/ESA, 2000. Data and maps currently at the TEMIS website [see this page] |
Local decreases of ozone concentration of 10-30 DU on scales of 1000 to 3000 km have been reported already earlier, but in the decrease on 30 November 1999 was rather large.
This "ozone mini-hole", which formed in a short period of time (less than a
day) and had a horizontal size of about 1000 km, was probably caused by a
combination of chemical processes and dynamical processes in the atmosphere.
The latter processes where of greatest importance in
this case, resulting in locally very low temperatures:
simulations have shown that based upon the ozone distribution of 25
November 1999 and just using actual wind fields (no new ozone data) an area
of low ozone values has developed on 30 November above Northwestern Europe,
similar to what is actually measured on 30 November.
The ozone concentrations "filled up" again in the next few
days to values above 250 DU due to dynamical processes; see also
the graphs shown below.
Ground measurements on 30 November 1999 with a Brewer spectrometer by Marc Allaart (KNMI, De Bilt) showed that above The Netherlands at 11:51 UTC the ozone concentration was 198.4 DU; an hour later it was 197.7 DU. The daily radiosonde measurements showed that at 12:00 UTC it was -80.6° C at an altitude of 19875 meters (52.5 hPa), sufficiently low for PSCs to form and ozone values to drop dramatically.
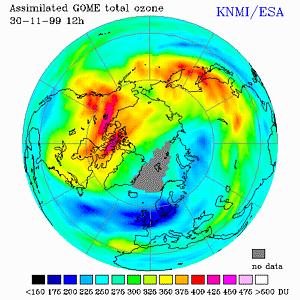
Observations by GOME, processed at the KNMI, give similar low ozone values, as the picture below shows; the minimum value found was 185 DU at 56°N, 14°E -- see the pictures below. Also NASAs ozone instrument TOMS showed record low values in the same area: 175 DU -- the same as GOMEs value to within measurement uncertainties. TOMS actually found that day the lowest value ever recorded on the Northern hemisphere that day: 165 DU at 56°N, 4°E.

|
The total ozone concentration at 30 November 1999 given in Dobson Units (DU),
assimilated using observations from the Global Ozone Monitoring
Experiment (GOME) onboard ESA's ERS-2.
The "mini-hole" is the patch of very low ozone values (just under 200 DU,
coloured dark blue) above the North Sea, around 10° E and
55° N; 0° longitude is pointing downward.
The grey patch over the North Pole is an area marked as "no data": in this area the error on the ozone values is larger then the limit normally used for plotting -- see also the graph below. (Click on the image for a larger version; 81kb.) ===> whole world picture (80kb) |
| source: GOME Fast Delivery Service, © KNMI/ESA, 2000. Data and maps currently at the TEMIS website [see this page] |

|
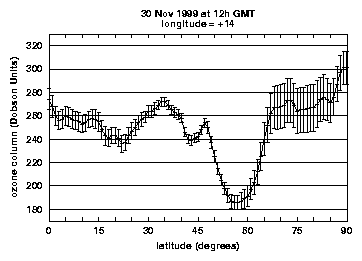
The total ozone concentration at 30 November 1999 given in Dobson Units (DU)
as function of latitude on the Northern hemisphere for longitude 14° East.
The "mini-hole" is the dip in the ozone values around 56° North.
The error bars indicate the 1-sigma forecast error in the assimilation model; between about 68° and 85° North this error is so large that the ozone field is not plotted in the figure above. (Click on the image for a larger version; 6kb.) |

|
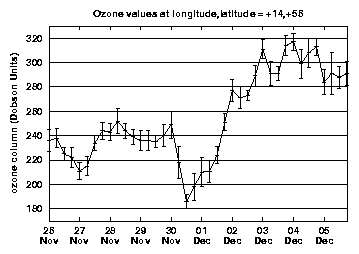
The total ozone concentration given in Dobson Units (DU)
from 26 November until 5 December 1999 at 0h, 6h, 12h and 18h GMT
at longitude 14° East and latitude 56° North.
The minimum value was reached around 12h GMT at 30 November (186 DU),
the moment of the ozone field and latitudinal plots above.
The error bars indicate the 1-sigma forecast error in the assimilation model. (Click on the image for a larger version; 8kb.) |
|
source: GOME Fast Delivery Service © KNMI/ESA, 1999/2001. Data and maps currently at the TEMIS website; these particular graphs are purposely made for this page. |
|
More information:
===> Press Releases from
KNMI/ESA and NASA
===> Enkele krantenartikeltjes (Dutch)
For scientific info, see the paper "Ozone mini-hole observed over Europe, influence of low stratospheric temperature on observations" by Allaart et al. in Geophys. Research Letters 27 (no. 24), pp. 4089-4092, 2000 [the paper at the GRL website]
<=== About ozone and the formation of the ozone hole
===> Southern Hemishphere ozone values
<=== My post-doc. research at KNMI page
 Jos van Geffen --
Home |
Site Map |
Contact Me