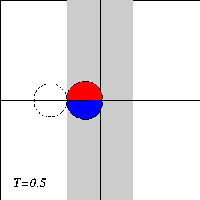
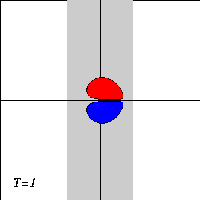
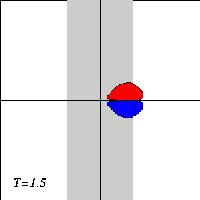
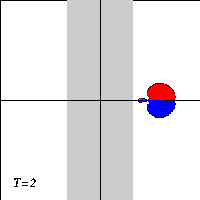
(The initial situation is drawn in the left figure with a dashed line.)

Initialisation
Dipole:      velocity: U = 2; maximum initial vorticity 44.25
             radius: a = 0.5
             angle of dipole axis with X-axis: 0 degrees
             position: centre of the domain (-1.5,0)
Computation: domain: X = (-3, ..., 3), Y = (-3, ..., 3)
             no. of grid points from wall to wall: (129, 129)
             boundary conditions: stress-free along all walls
             standard Arakawa scheme used
             no rotation effects included
             viscosity: nu = 10^-3 (i.e. Re=1000 at T=0)
             time step: dt = 0.01
             final time: T = 2.5
Bottom topography: cosine ridge along the Y-axis:
             fluid depth: H(X,Y) = 1.d0-A*cos(X*pi/w)-A
               amplitude: A = 0.2 (max. height then 0.4)
                   width: w = 1.0
                     for: -w < x < +w
             outside this region: H=1 (default fluid depth)
Tracers:     along vorticity contours (i.e. along streamlines)
             of the Lamb dipole at vorticity levels: 0.1
             and a single tracers at each extremum
Some results
The tracers at the extrema of vorticity cross the left edge of the topography x=-1 at T=0.26, they cross the top x=0 at T=0.92, and the right edge x=+1 at T=1.55.
The evolution of the tracer contours looks like this:


(The initial situation is drawn in the left figure with a dashed line.)
The following plots show the maximum of vorticity as function of
time and the surface of the tracer contour in the positive (upper)
half of the dipole as function of time:
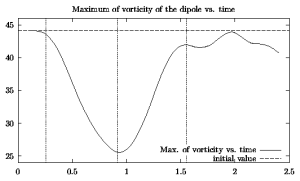
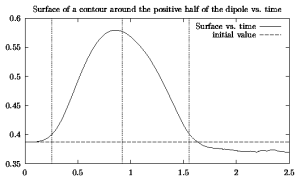
(The vertical lines in both graphs show the moments in time
when the dipole crosses the edges and the top of the ridge.)
Notes:
<=== Lamb dipole crossing a ridge
 Jos van Geffen --
Home |
Site Map |
Contact Me