 Jos van Geffen --
Home |
Site Map |
Contact Me

Initialisation
Dipole:      velocity: U = 2; maximum initial vorticity 22.1
             radius: a = 1
             angle of dipole axis with X-axis: 0 degrees
             position: centre of the domain (0,0)
Computation: domain: X = (-3, ..., 3), Y = (-3, ..., 3)
             no. of grid points from wall to wall: (129, 129)
             boundary conditions: stress-free along all walls
             standard Arakawa scheme used
             no rotation effects included
             no bottom topography
             viscosity: nu = 10^-3 (i.e. Re=1000 at T=0)
             time step: dt = 0.01
             final time: T = 10
Tracers:     along vorticity contours (i.e. along streamlines)
             of the Lamb dipole at vorticity levels: 0.1, 6.0,
             12.0, 18.0; and a single tracers at each extremum
Some results
Positions (X,Y) of the tracer at the maximum of vorticity in
the 'corners' of its path, shown by the pictures; for the
minimum they are mirrored in the Y-axis.
Futher: D = distance traveled since previous point (assuming
            a straight line)
        V = average velocity over that distance; see below

 NTIME    TIME         X           Y         D       V
    0  0.0000E+00  0.0000E+00  0.4805E+00    -       -
  147  0.1470E+01  0.2327E+01  0.6604E+00  2.4164  1.6438
  278  0.2780E+01  0.2326E+01  0.2330E+01  1.6696  1.2745
  431  0.4310E+01  0.5690E-02  0.2507E+01  2.3271  1.5209
  590  0.5900E+01 -0.2307E+01  0.2304E+01  2.3216  1.4601
  726  0.7260E+01 -0.2307E+01  0.7013E+00  1.6027  1.1785
  892  0.8920E+01 -0.4498E-02  0.5129E+00  2.3102  1.3917
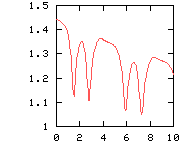
The highest velocity is reached when the dipole halves are
semi-circular. The velocity is lowest in the corners. This
can also be seen from this graph: Courant number CFL as a function of time
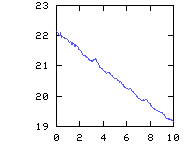
  max. and -min. of vorticity, which overlap
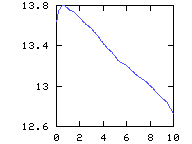
 pos. and -neg. circulation, which overlap
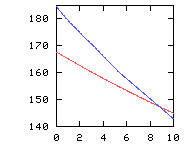
 energy*7(red) and enstrophy(blue)
 Note
The tracer lines are not always smooth. The reason for this is that the representation of the lines by points is not always accurate enough. But since these tracers only passively follow the flow, this has no effect on the computations. It needs repair, though.
<=== Lamb dipole in a domain with stress-free walls
 Jos van Geffen --
Home |
Site Map |
Contact Me