(Click on the image for a larger version; 14kb.)
|
|
Seasonal deviations in the ozone concentration with respect to the
pre-ozone-hole averages over the period 1957-1978 over Antarctica until
1995.
The graphs shows that there has been a rapid decline in the ozone
concentration during the austral spring and a lesser decline during
the austral summer since 1978.
(Click on the image for a larger version; 14kb.) |
| source: "The Changing Ozone Layer" by R.C. Bojkov © World Meteorological Organisation, 1995 |
|
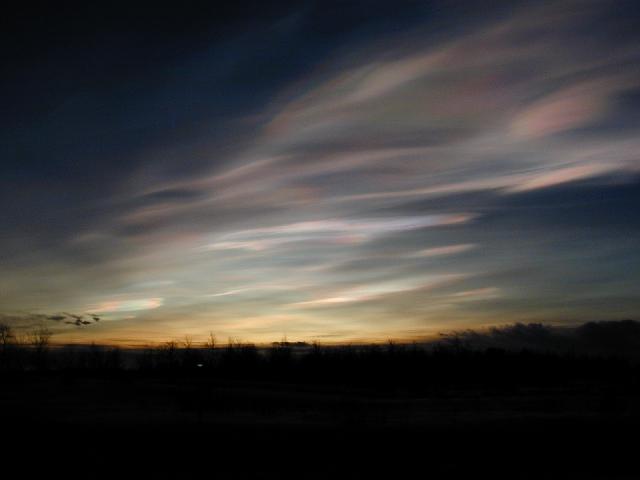
Example of a Polar Stratospheric Cloud in the Arctic region, taken from the
"media week" (Jan. 21 - 28, 2000) images of the
SOLVE Home
Page. SOLVE stands for SAGE (=Stratospheric Aerosol and Gas Experiment) III Ozone Loss and Validation Experiment, and it is a measurement campaign designed to examine the processes controlling ozone levels at mid- to high latitudes in the Arctic, from a base at Kiruna in Sweden. The full image was originally 360kb; clicking on the image gives a reduced version of 18kb. |
| source: SOLVE Home Page |
Under normal circumstances the harmful substances chlorine, bromine and
other CFCs are bound into harmless molecules by, among others, nitrogen.
These molecules break up under the influence of UV light from the Sun,
shining just of the horizon in early spring.
As long as nitrogen is freely available, the harmless molecules can easily
form again.
The PSCs, however, absorb the nitrogen efficiently, making nitrogen
unavailable to bind CFCs. Hence, more and more chlorine, bromine, etc.
remaims free as the Suns climbs above the horizon and -- in combination
again with the UV light from that same Sun -- chlorine, c.s. catalyse
the break-down of ozone efficiently.
In the polar winter a large vortex (an anti-cyclone, or low-pressure area) with a size of about Antarctica is formed because of strong westerly winds. The edge of this vortex is a barrier for transport towards the polar region of (among others) ozone, which is being produced mainly in tropical regions. This means that the decrease of ozone inside the vortex due to the chemical processes is not balanced by an inflow of ozone from the (sub)tropics.
|
The total ozone concentration given in Dobson Units (DU), where blue are
low and black extremely low values, green represent average values, above
the Southern Hemisphere at 21 September 1999, assimilated using observations
from the Global Ozone Monitoring Experiment (GOME) onboard ESA's ERS-2.
The edge of the polar vortex is at 200-250 DU (blue-cyan), where there is
a sharp gradient in the ozone concentrations. Over the South
Atlantic there is an area with high ozone concentrations:
400 DU and more.
[0° longitude is pointing to the right.]
(Click on the image for a larger version; 75kb.) |
| source: GOME Fast Delivery Service, © KNMI/ESA, 1999. Data and maps currently at the TEMIS website [see this page] |
The decrease in ozone is 2-3% per day and about half October some 60% of the ozone is gone. Between 13 and 22 km, the lower stratosphere with the PSCs, virtually all ozone is then gone -- this is called the ozone hole. Above 22 km there is almost no decrease in ozone consentration, as PSCs are not formed that high up.
Gradually the Sun rises and this heats up the atmosphere. The formation of clouds changes and the chemical reactions freeing chlorine, bromine, etc. become less and less efficient as the temperature rises. At the same time more and more instabilities occur in the polar vortex and in November the vortex finally breaks down, thus allowing tropical ozone to flow to the South Pole again, filling the ozone hole to more normal concentrations. And with the disappearance of the PSCs nitrogen is again available to bind chlorine, bromine, etc.
The emergence of the polar vortex at the end of the austral winter
is a natural phenomenon, so are the low temperatures and the blocking of
inflow from tropical ozone towards the pole.
The CFCs and such that are responsible for the chemical reactions that
destroy the ozone are not natural: they are man-made and remain in the
atmosphere for many, many years since there are no natural processes that
break down chlorine, bromine, etc.
These substances will descend to the troposphere, for chlorine in the form
of HCl, making them unavailable for the destruction of the ozone. But this
is a very slow process! Chlorine, for example, can remain 60-120 years in
the atmosphere, and one chlorine molecule can break up to 100,000 ozone
molecules down in its lifetime.
The ozone depletion within the Antarctic polar vortex seems to have
stabalised, in the sense that the minimum values are more or less the same
over the past few austral springs because of the global ban on usage of CFCs
and such. So in due time the ozone values may rise again, giving less deep
ozone minima.
Due to the reduction of ozone in the austral spring, temperatures in the lower stratsphere around the South pole are nowadays some 10° C lower than in the 1960s. As this makes ozone reduction work over a longer period, the ozone hole (that is: the area of low ozone values) exists longer than before.
That ozone when it absorbes UV light heats up the atmosphere implies that
ozone is a so-called greenhouse gas.
The increase of carbon dioxyde (CO2) and many other greenhouse
gasses in the troposphere have given rise to an increase of the global
average temperature of the troposphere over the past decades.
One might think that when the troposphere becomes warmer, the lower
stratosphere -- which is right above the troposphere -- is warmed up as
well, thus hampering the ozone destruction reactions.
But this is definitely not the case!
Instead, because of dynamical transport effects in the atmosphere, a warmer
troposphere results in a warming up of the lower stratosphere, thus making
ozone destruction reactions work more efficiently.
On the other hand, the higher stratosphere as warmed up at the same time,
so that there the ozone destruction rate decreases.
What the effect of all of this will be on the total ozone concentration,
and thus on the size and depth of the ozone hole, is as yet rather
uncertain.
<=== About ozone and the formation of the ozone hole
===> Northern Hemishphere ozone values
<=== The 1999 ozone hole as seen by GOME
<=== My post-doc. research at KNMI page
 Jos van Geffen --
Home |
Site Map |
Contact Me
Jos van Geffen --
Home |
Site Map |
Contact Me